Output maps
The most important products of classification process are visualizations of trained models over the entire study site in form of raster maps. Due to the fact, that VCS supports a fuzzy classification mode, the information conveyed in model prediction is much richer than just traditional categorical map. Therefore, VCS supports a vast number of different mapping products, including single-band probability rasters, hard-boundary categorical maps, multi-class fuzzy renderings in many color blending modes as well as visualizations showing estimations of classification reliability / uncertainty index.
Single-band probability rasters show predicted probabilities of a specific class. In many cases, when the classification scenario contains categories directly corresponding to ecologically relevant objects (e.g. vegetation communities, disturbances, structural or artificial features), this type of output can be a final product of direct interest to end-users.
Traditional categorical maps are shown using colors representing the most probable class predicted in every pixel. They omit the fuzzy / probabilistic output produced by Random Forest classifiers. The output map has an embedded color palette which may be easily manipulated using popular GIS software. This map can be used for many geospatial analyses performed using GIS processing tools, e.g. generating various cartographic representations, automatic vectorization, or GIS post-processing leading directly to habitat quality estimation.
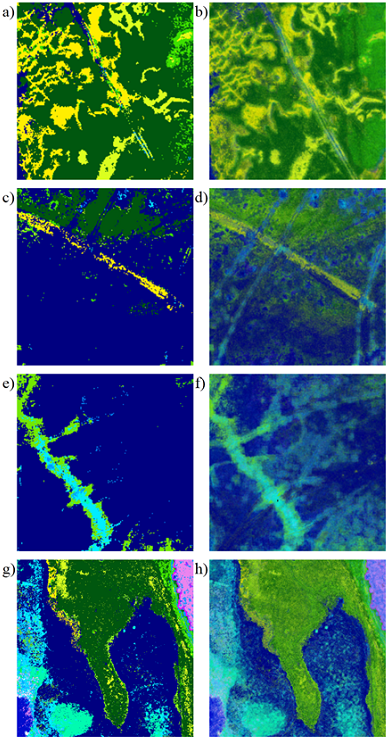
The multi-color, fuzzy map outputs are created using full fuzzy / probabilistic output from the classifier. They contain the largest amount of information, as potentially multiple classes can be predicted in the same pixel with varying proportions / probabilities. To represent the mix of many classes within a single pixel, a synthetic color is created by blending the colors of individual classes. Those maps are especially useful for visual interpretation by experts, revealing many subtle details and patterns, often beyond capabilities of traditional categorical maps. The figure below shows a side-by-side comparison of categorical (left column) vs. fuzzy / probabilistic output maps (right column), demonstrating the ability to visualize many features invisible on traditional categorical map (e.g. linear features (b), vehicle tracks (d), fine patterns of sub-dominant vegetation (f) or areas dominated by a mixed class (h)).